Last Updated on August 22, 2025 by Richard Martin Linga
The advantages of infographics in the Philippines are incredible. They turn complicated ideas into clear, easy-to-understand visuals by combining pictures and words. For instance, they grab attention quickly, making it easier for people to learn and remember information. Also, infographics are easy to share on social media, helping your message reach more people faster. In other words, they are a fun and powerful way to communicate. Above all, infographics create a stronger connection with your audience by making content more engaging. Therefore, using infographics is a smart way to improve any content strategy and make a lasting impact.

What are Infographics?
Infographics are pictures that use words and images to explain things in a simple way. They make hard ideas easy to understand by turning them into fun visuals like charts and drawings. For instance, a graph can show numbers in a way that’s easier to see and learn.
Infographics are colorful, so they grab your attention quickly. After that, they make it easier to remember what you learned. In other words, they are better than plain text because they’re fun and simple. The advantages of infographics in the Philippines include making learning and sharing ideas faster and more enjoyable. If you need help creating great infographics, an SEO specialist in the Philippines can assist you!
Advantages of Infographics in Digital Marketing

- Grab Attention
- Simplify Complex Ideas
- Boost Social Shares
- Drive Website Traffic
- Improve Branding
- Increase Engagement
- Save Time
- Measure Success
Grab Attention
Infographics are colorful and fun to look at. They catch people’s eyes quickly and stand out from plain text. So, when you use them, people are more likely to stop and pay attention to your message.
- Quick Appeal: Bright colors and pictures grab attention right away.
- Standout Content: Infographics are easy to remember because they look different from other content.
Simplify Complex Ideas
Infographics help turn difficult ideas into easy-to-understand pictures. For example, charts or simple drawings can explain something quickly. In other words, they make learning easier and more fun.
- Visual Learning: Pictures make it easier to understand facts and numbers.
- Clear Message: They help break down big ideas into smaller, easy steps.
Boost Social Shares
People love sharing infographics on social media. They are fun and creative, so people want to share them with their friends. For instance, when someone sees a great infographic on Instagram, they might share it with others.
- Wider Reach: Infographics are shared across different platforms like Facebook and Instagram.
- Fun to Share: They make sharing enjoyable because they are interesting and eye-catching.
Drive Website Traffic
Infographics can bring more people to your website. They often have backlinks to your site, which helps with your SEO. So, people will find your site when they share the infographic. Consider monthly SEO services to maximize this benefit.
- SEO Boost: Backlinks improve your search ranking.
- More Visitors: More people visit your site when infographics are shared.
Improve Branding
Infographics help make your brand stand out. You can use your brand colors, logo, and style. This way, every infographic reminds people of your business, helping them remember you better.
- Brand Recognition: Using your brand colors and logo makes your content more recognizable.
- Strong Identity: Helps build a lasting impression with your audience.
Increase Engagement
People spend more time looking at infographics because they’re interesting and easy to understand. Therefore, your audience is more likely to stay engaged with your content.
- More Time Spent: Infographics keep people engaged longer than plain text.
- Interactive Design: Fun visuals encourage more interaction.
Save Time
Infographics make learning faster. They explain things quickly with simple visuals, so people can understand more in less time.
- Quick Information: Infographics give facts clearly and fast.
- Easy to Digest: They break down complex information into easy visuals.
Measure Success
You can easily track how well your infographics work. By checking how many people share or visit your website, you can see how effective they are.
- Track Performance: See how many shares and visits your infographic gets.
- Easy to Measure: Infographics make it simple to check success with numbers.
By following these 8 advantages, you’ll see how infographics can improve your digital marketing. If you want to learn more, consider SEO services in the Philippines to boost your online presence even further.
Types of Infographics
Statistical Infographics
Statistical infographics show numbers and data in a way that’s easy to understand. They use charts and graphs, like bar charts or pie charts, to explain information. For instance, they can show how many people like pizza compared to burgers. So, they help make numbers less confusing and more fun to look at.
Informational Infographics
These infographics explain topics using pictures and simple words. In other words, they make learning about something easy and clear. For instance, they can teach you about animals or explain how recycling works. Therefore, they are great for helping people understand new ideas quickly.
Timeline Infographics
Timeline infographics show events in the order they happened. For instance, they can tell the story of how a company grew or what happened in history. Above all, they make it easy to see how things happened step by step. So, they’re helpful when you need to understand a series of events.
Process Infographics
Process infographics show how something works by explaining the steps. For example, they can show how to bake a cake or how plants grow. In addition, they make it simple to follow instructions. Therefore, they are perfect for explaining things that have many steps.
Comparison Infographics
Comparison infographics show how two or more things are alike and different. For instance, they can compare the features of two phones side by side. So, they make it easier to choose between options. Above all, they are very helpful for making decisions quickly and clearly.
There are different types of infographics that help us show information in clear ways. The advantages of infographics in the Philippines include making data easy to understand and remember.
Measuring the Effectiveness of Infographics
Introduction to SEO: Unlocking the Power of Online Visibility
-
1
What is SEO?
- SEO stands for Search Engine Optimization.
- It's the practice of optimizing websites to improve their visibility and ranking on search engine results pages (SERPs).
-
2
Why is SEO Important?
- Increased visibility: SEO helps your website appear higher on SERPs, leading to more organic traffic.
- Credibility and trust: Higher rankings establish trust and credibility with users.
- Cost-effective: Organic traffic from SEO is free, making it a cost-effective marketing strategy.
- Long-term results: Properly optimized websites can maintain high rankings for a long time.
-
3
How Search Engines Work?
- Crawl: Search engines use bots to discover web pages and gather information.
- Index: The collected data is stored in an index, a massive database.
- Rank: Algorithms analyze indexed pages to determine their relevance and rank them on SERPs.
-
4
SEO Elements
- Keywords: Research and optimize relevant keywords to target your audience.
- On-page optimization: Improve website elements like titles, headings, and meta tags.
- Content creation: Develop high-quality, informative, and engaging content.
- Backlinks: Earn quality backlinks from other reputable websites.
-
5
Types of SEO
- On-Page SEO: Optimizing website elements like keywords, titles, headings, and content.
- Off-Page SEO: Building backlinks and social signals to increase website authority.
- Technical SEO: Enhancing website performance and ensuring search engines can crawl and index your site properly.
-
6
SEO Best Practices
- Mobile optimization: Make your website mobile-friendly for better user experience.
- Site speed: Improve loading times to enhance user engagement and search engine rankings.
- User experience: Create intuitive navigation, user-friendly design, and easy-to-read content.
- Quality backlinks: Earn backlinks from reputable and relevant websites.
-
7
SEO Tools
- Google Analytics: Monitor website traffic, user behavior, and performance metrics.
- Google Search Console: Track website indexing status and resolve technical issues.
- Keyword research tools: Find relevant keywords and analyze search volume and competition.
- SEO plugins: Enhance on-page optimization and improve website performance.
-
8
SEO Mistakes to Avoid
- Keyword stuffing: Overusing keywords unnaturally can harm your rankings.
- Poor user experience: Difficult navigation, slow loading, or low-quality content can deter users.
- Ignoring mobile optimization: Mobile users make up a significant portion of internet traffic.
- Black hat techniques: Unethical practices like buying links or keyword spamming can result in penalties.
-
9
Unlock the Power of Online Visibility with SEO
- Research keywords, optimize your website, and create valuable content.
- Stay up to date with SEO trends and best practices.
- Monitor your website's performance using analytics tools.
- Partner with experts for effective SEO strategies.
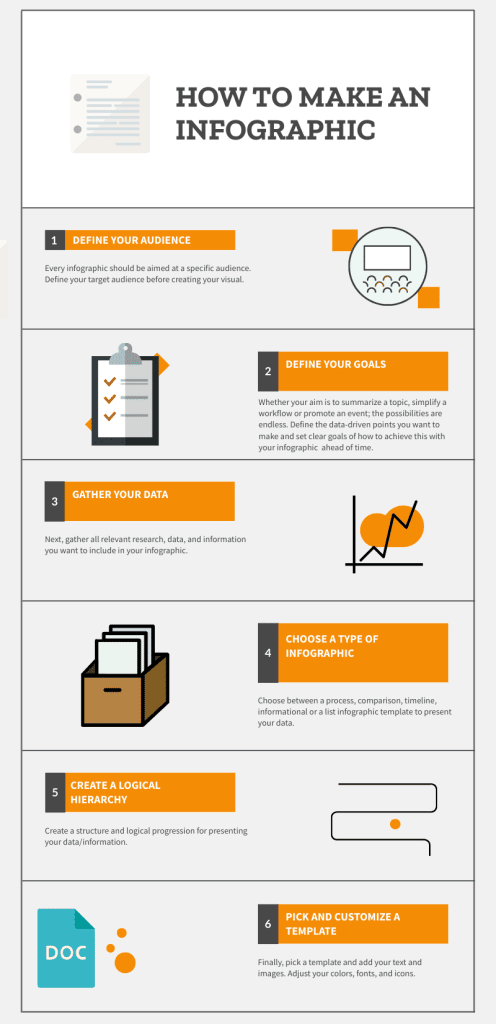
Remember, this is just an outline, and the actual design and layout of the infographic can be customized to suit your needs.
To see how well infographics work, we look at different things. The advantages of infographics in the Philippines include making information clear and easy to share.
Track Shares
See how many times people share your infographic on social media. For instance, more shares mean people like it and want others to see it too. So, tracking shares can show how popular your infographic is.
Check Engagement
Look at how long people spend looking at your infographic. In other words, the more time they spend, the more interested they are. Above all, it shows your infographic is holding their attention.
Monitor Traffic
See if your infographic brings more visitors to your website. For instance, when traffic increases, it means your infographic is working well. So, tracking traffic helps you understand if it’s successful.
- Shares: Shows people like your infographic.
- More Engagement: Shows people find it interesting.
- More Traffic: Shows your infographic is bringing visitors.
Best Practices for Infographics
Keep It Simple
Use simple words and pictures. So, people can understand your message quickly and easily without feeling confused.
Use Bright Colors
Bright colors catch the eye and make your infographic fun to look at. In other words, they help your infographic stand out from the crowd.
Tell a Story
Make sure your infographic has a clear beginning, middle, and end. For instance, this makes it easier for people to follow and remember what they’ve learned. Therefore, storytelling makes your infographic more effective.
Check Your Facts
Always make sure your information is true and correct. Above all, accurate information helps people trust your infographic and your message.
- Simple Words: Easy to understand.
- Bright Colors: Eye-catching and attractive.
- Clear Story: Easy to follow.
- Accurate Information: Builds trust.
Key Takeaway
The advantages of infographics in the Philippines are easy to see. They make information simple and fun to understand. For instance, bright colors and simple words catch people’s attention quickly. In addition, infographics tell a story that’s easy to remember. In other words, they help people learn faster and share ideas more easily.So, using infographics can make your content better and reach more people. Above all, always check your facts to keep your infographics accurate and trustworthy. Therefore, follow these tips to create effective infographics. If you need help, hire me to design engaging and informative infographics for you.
FAQs
1. What are infographics?
Infographics are pictures or visuals that help explain things using both images and words. They make difficult ideas easier to understand by turning them into something fun to look at.
2. How do infographics help learning?
Infographics use pictures and words, so it’s easier for people to remember and understand things. They simplify tough information and make it fun to learn.
3. Why are infographics good for social media?
Infographics are colorful and eye-catching. They grab people’s attention and are more likely to be shared, so your message reaches more people.
4. How can infographics improve my website traffic?
Infographics often include links to your website. So, when people share your infographic, it helps more visitors find your website and boosts your online visibility.
5. How do infographics help businesses?
Infographics help businesses explain their products or services clearly and quickly. This makes it easier for customers to understand, which can lead to more sales.
6. Why should I use infographics in my marketing?
Infographics are engaging and easy to share. They help your brand stand out, making it more likely that people will remember your message.
7. Can infographics improve SEO?
Yes! Infographics can boost SEO by bringing more visitors to your website. When shared, they create backlinks, which can help your site rank better in search engines.
8. Are infographics easy to create?
Infographics are easy to create, especially with the right tools. There are many online tools that can help you turn information into visuals, making the process fast and simple.
9. Can I use infographics for all types of content?
Yes! Infographics can be used for blog posts, social media, presentations, and even emails. They work well for any content that needs to explain or summarize information.
10. How do I know if my infographic is working?
You can track how many times your infographic is shared, how long people stay on your website, and how much traffic it brings. These things show how well it’s working.